
Time & expense budgets
Budget hours and expenses by matter, task, employee and period, then compare actuals with work remaining.
Your margins and recovery variances in real time.
Tempolia connects budget and actuals, time, expenses, cost and selling prices, invoicing and payments. Margin measures economic performance; recovery variance compares fees with commercial value; completion rate, work remaining and capacity explain progress.

Budget hours and expenses by matter, task, employee and period, then compare actuals with work remaining.
Schedule fees, deposits, milestones and expected revenue by sales code and period.
Compare potential time net of leave with budgeted work by team, employee and period.
Net billing − cost price of time and expenses: measure economic profitability.
Net billing − commercial value of time and expenses: explain recovery variance.
Separate not-yet-due, overdue and late balances, with reminder actions, in aged receivables.
Cost price measures internal cost; selling price values the work commercially. This distinction supports two complementary views: cost margin and recovery variance against commercial value.
PRInternal cost used to calculate margin.
PVCommercial value used to analyse recovery variance.
The hourly cost price can be entered manually or calculated from annual salary, employer contributions, bonuses and fixed overheads. Annual attendance time, adjusted by the billable percentage, allocates those costs across the selected productive hours.
(salary + contributions + bonuses + overheads) ÷ productive hours
The standard rate can be current or stored historically with an effective date. A rate negotiated for one employee and matter takes priority when valuing both budgeted and recorded time.
A billable task can carry its own hourly rate so that work is valued by task complexity rather than by the person performing it. Matter and task coefficients can also adjust the employee selling price.
Value equals the quantity produced multiplied by a unit price: the task default, a rate negotiated for the matter, or volume rates triggered at defined thresholds. Depending on configuration, brackets can apply to the whole quantity or progressively by tier.
History is preserved: cost and selling prices are calculated when a line is created or modified. A rule change does not silently rewrite existing lines; recalculation uses an explicitly selected range of dates and records.
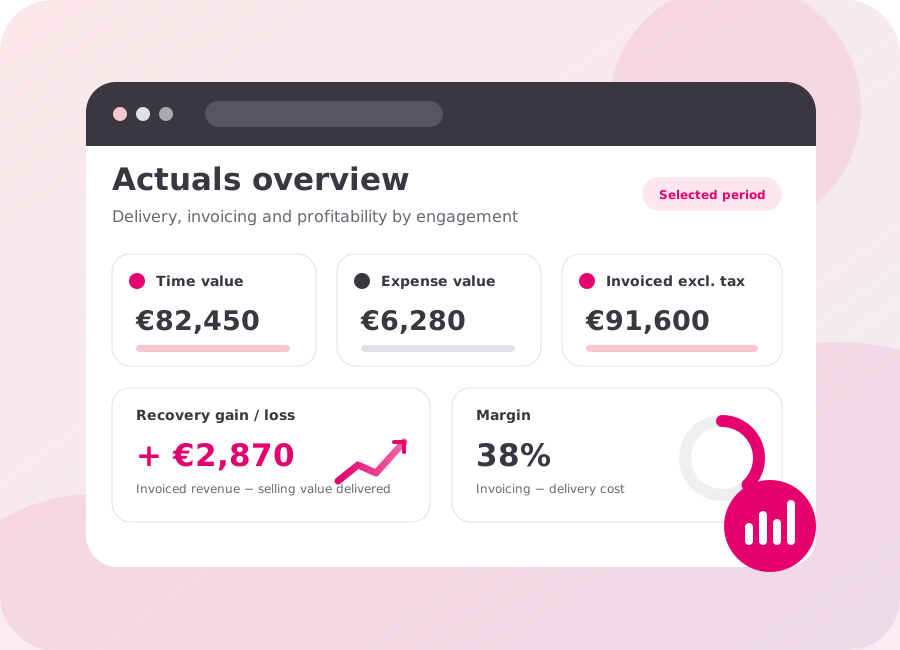
Nearly fifty reports covering capacity, budgets, work, billing, margin and receivables.
Choose rows, columns, filters and value — time, quantity, PR or PV — then save the view.
Export the filtered result to Excel or PDF, or connect Power BI directly to your Tempolia database.
Time, expenses, budgets, invoices and payments share the same dimensions.
Budgets, actuals, work remaining, PR, PV, billed and collected amounts.
Customer, engagement, project, activity, staff member, task or period.
Identify under-capacity, overruns, under-recovery, weak margin or overdue receivables.
Reallocate capacity or revise a rate, fixed fee, due date or reminder action.
Potential time net of leave, budgets, actuals and work remaining by team and period.
Time, expense and billing budgets, renewal and comparison with actuals.
Compare net billing, commercial work value and cost of time and expenses.
Understand the calculationsTrack progress, consumed effort, work remaining and forecast at completion.
Separate not-yet-due and overdue receivables, lateness and reminder actions.
Analyse working capitalBuild, save and export views with their filters and permission scope applied.
Compare billing / PV and billing / PR on the same scope: an engagement can be under-recovered while still remaining profitable.
Identify an overrun before the assignment ends and reallocate resources.
Bring together capacity, planned time, leave and deadlines to reduce overloads.
Use balances and aged receivables to target reminders and measure outstanding amounts.
Time, expenses, budgets, invoices and payments share the dimensions used by the organisation. They can be analysed by customer, engagement, project, activity, staff member, group, task or period and combined in reports and pivot tables; filters and permissions preserve each user’s authorised scope.
Yes. Time, expense and invoicing budgets are compared with actual data for the same customers, engagements, projects, phases or periods. Progress and remaining work complete the comparison, helping teams identify an overrun, revise capacity or adjust a due date before delivery is complete.
Yes. Operational reports and pivot tables can be exported to Excel or PDF, and results can feed Power BI depending on the plan. The export retains the filters and permission scope applied to the view, so analysis can continue without exposing data the user is not authorised to access.
Yes. Tempolia combines valued time, its cost, expenses, invoicing, the budget and remaining work to show current margin. Depending on configuration, the same data produces a forecast at completion, which can be revised when workload, price or timing changes.
Analyses compare the invoiced amount with the theoretical selling value of time and expenses, then show the recovery variance. They can also combine costs, budget and margin; filters by customer, engagement, manager, activity or period help focus on differences that need explaining or correcting.
Yes. It combines potential working time, leave, budgets and assignments to calculate genuinely available capacity. Views by team, staff member or period highlight overloads and gaps, so an assignment can be moved, a due date reviewed or forecast work adjusted.
Yes. Balances, due dates, payments and aged receivables complement delivery and invoicing metrics. Overdue amounts can be reviewed by customer or age to prioritise reminders, measure receivables and distinguish a delivery, invoicing or collection issue.
Yes, subject to permissions and configuration. Reports can group or compare companies, sites, teams, activities and managers on shared dimensions while retaining enough detail to explain a variance; every user sees only the entities and data within their scope.
 Topic Brochure
Compare budgets, actual costs, fees and billing variances for each engagement.
Open the PDF Topic Brochure
Dashboards, variances, budgets and indicators drawn from day-to-day activity.
Open the PDFUse budgets, time entries, invoices and remaining work to see how you can track margins, recovery variance and team workloads.